
Where your integrity data comes together
- Cathodic Protection Surveys
- Right-of-Way Inspection
- Pigging and Chemical Records
- In-line Inspection Records
- Regulatory data
- Risk Score for every line
- Mapped CP, ROW, and Mitigations
- KPIs tracked per line
- Reports in pdf and excel formats
Four things it does
The Map
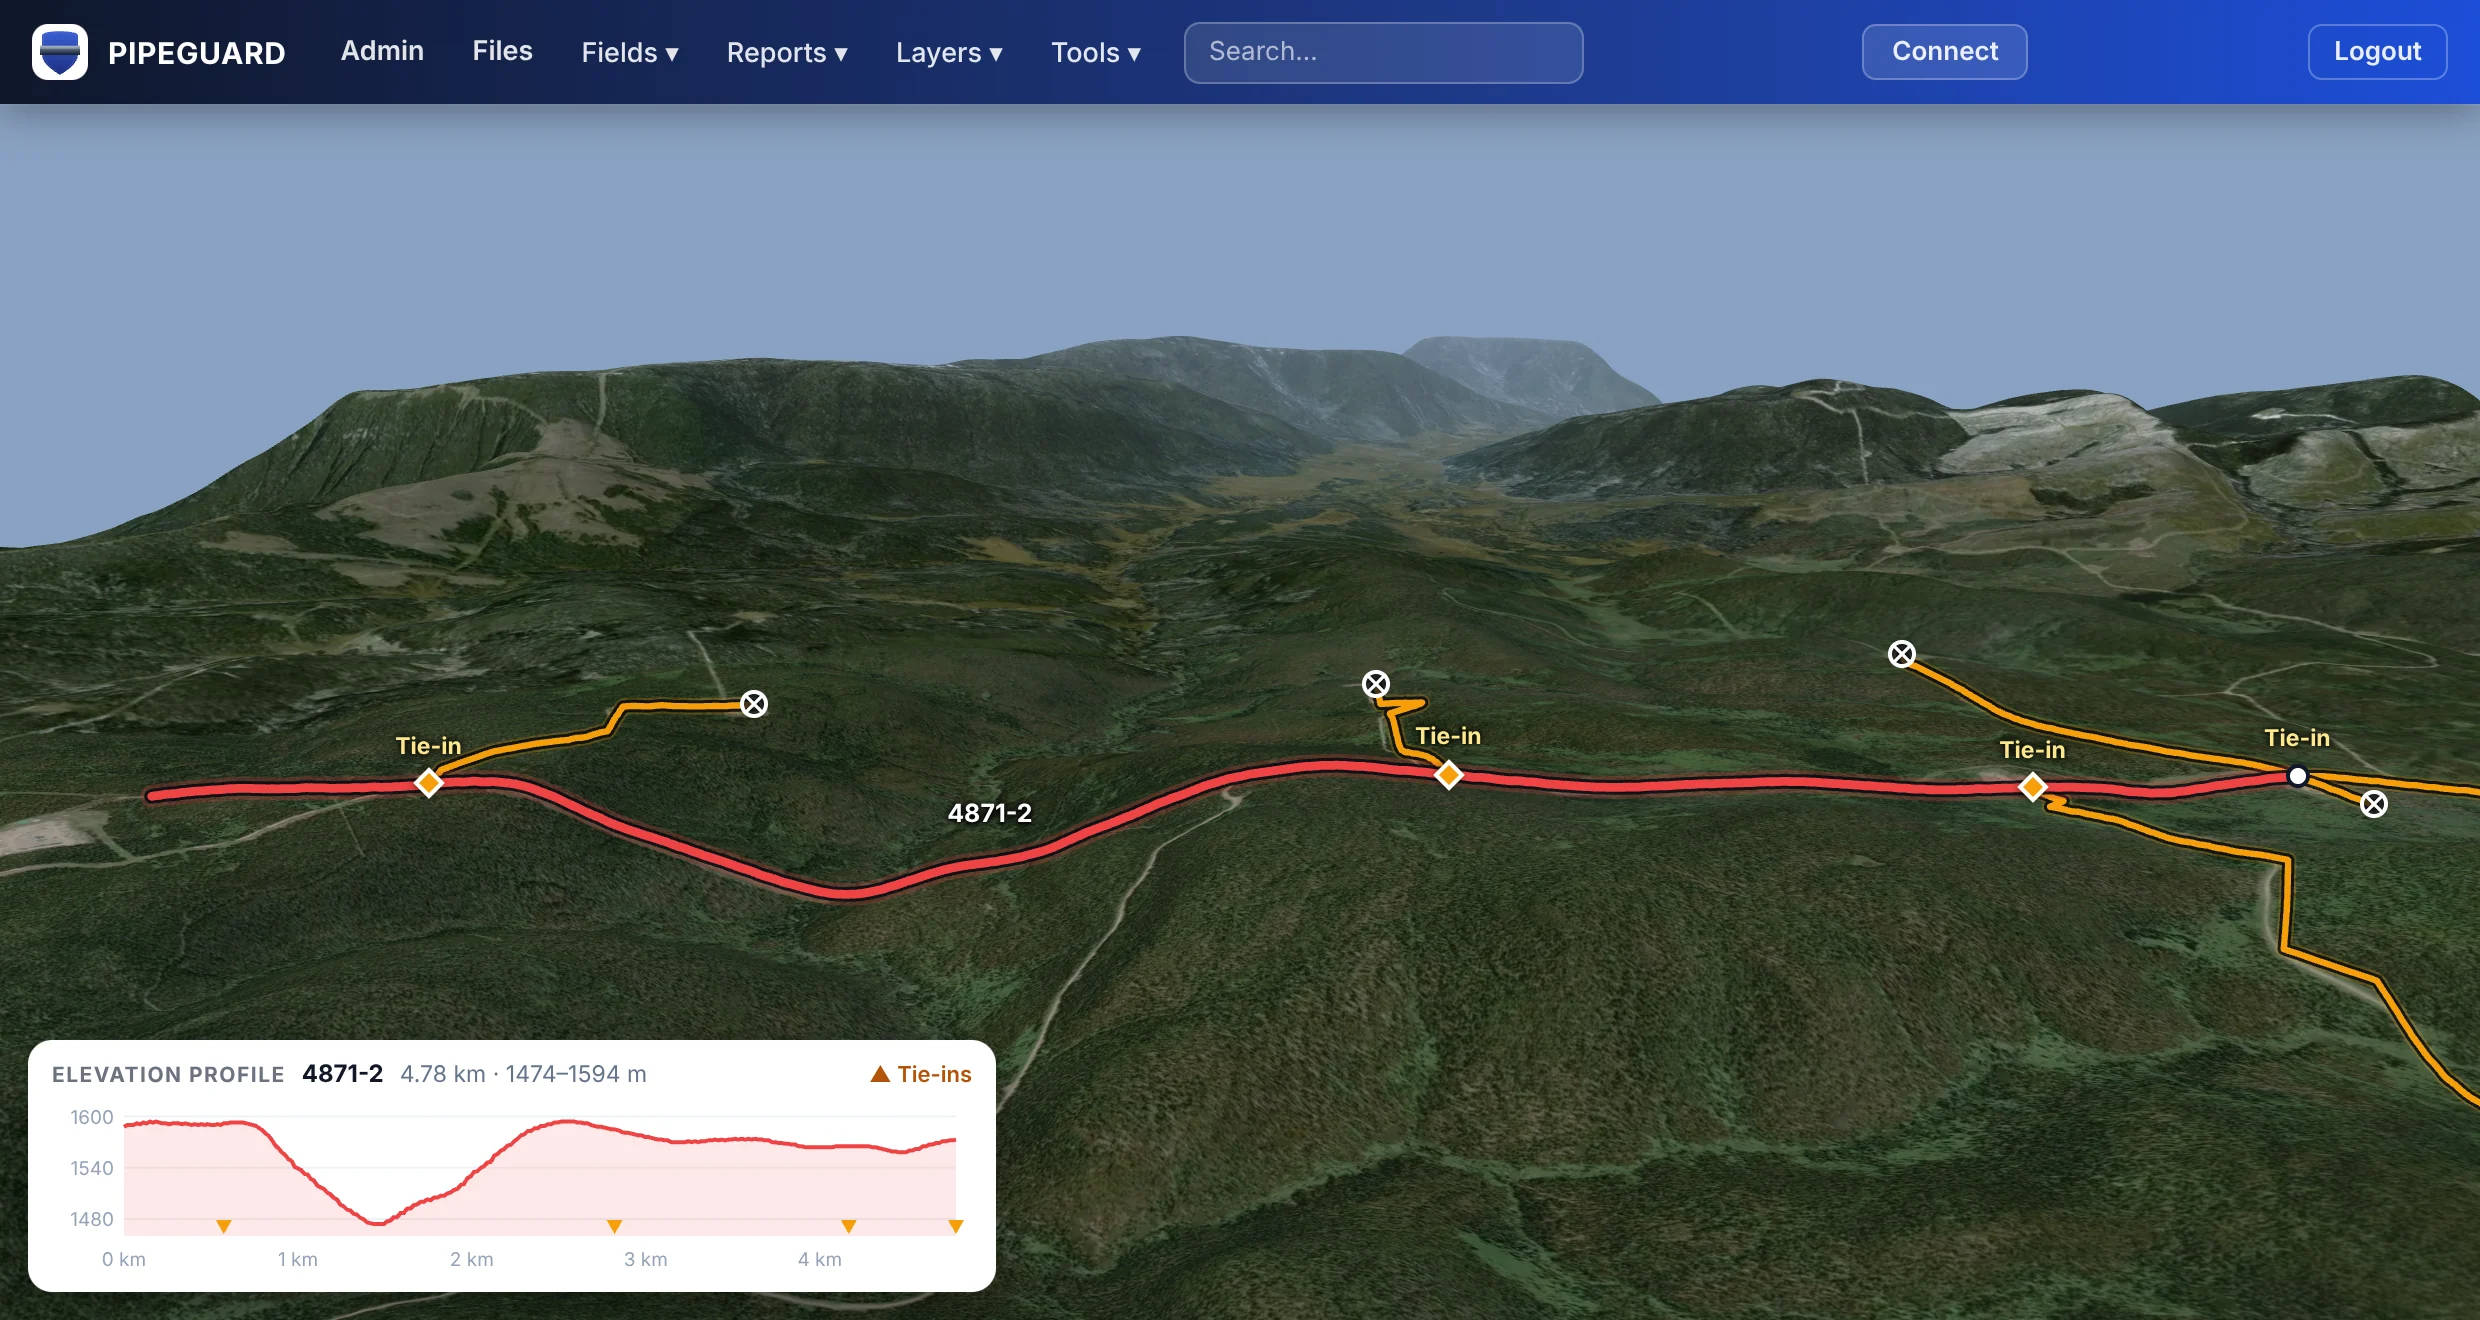
An interactive map of pipelines and wells, set over high-resolution satellite imagery. Dedicated layers display risk, cathodic protection, pigging, right-of-way inspection findings and failure history for each line, and a timeline feature that shows how conditions have changed year over year. There are also built-in tools to support day-to-day planning.
Data Management Tool
PipeGuard has a built-in data management system that can store reports and records and be assigned to pipelines for easier search. Files can also be tagged by category, including in-line inspection, integrity digs, cutout and UT/RT riser inspections, and licence amendments. There is the ability search by licence, filter by field and download in bulk.
The Risk Engine
PipeGuard uses a proprietary risk engine to score every operating line. A likelihood score is assigned from the line’s remaining life and other threat factors, and a consequence score from the calculated cost of a failure in dollars and other factors. Together they place each line on the risk matrix from Low to Severe, with the driving threat named. The risk engine is flexible and can be configured to suit each company’s needs.
Reports and Performance Tracking
PipeGuard generates reports in PDF and Excel formats, scoped to a full field or a single line, and there is the ability to export pipelines to KML format for offline use. PipeGuard has a built-in Performance Tracker that records pigging, chemical treatment, cathodic protection KPIs and risk history for every line.
PipeGuard’s Risk Engine
PipeGuard's proprietary risk engine assigns a risk level from Low to Severe to each operating pipeline based on multiple factors like corrosion rates, consequence, failure history in the area, and calculated remaining life of the asset.
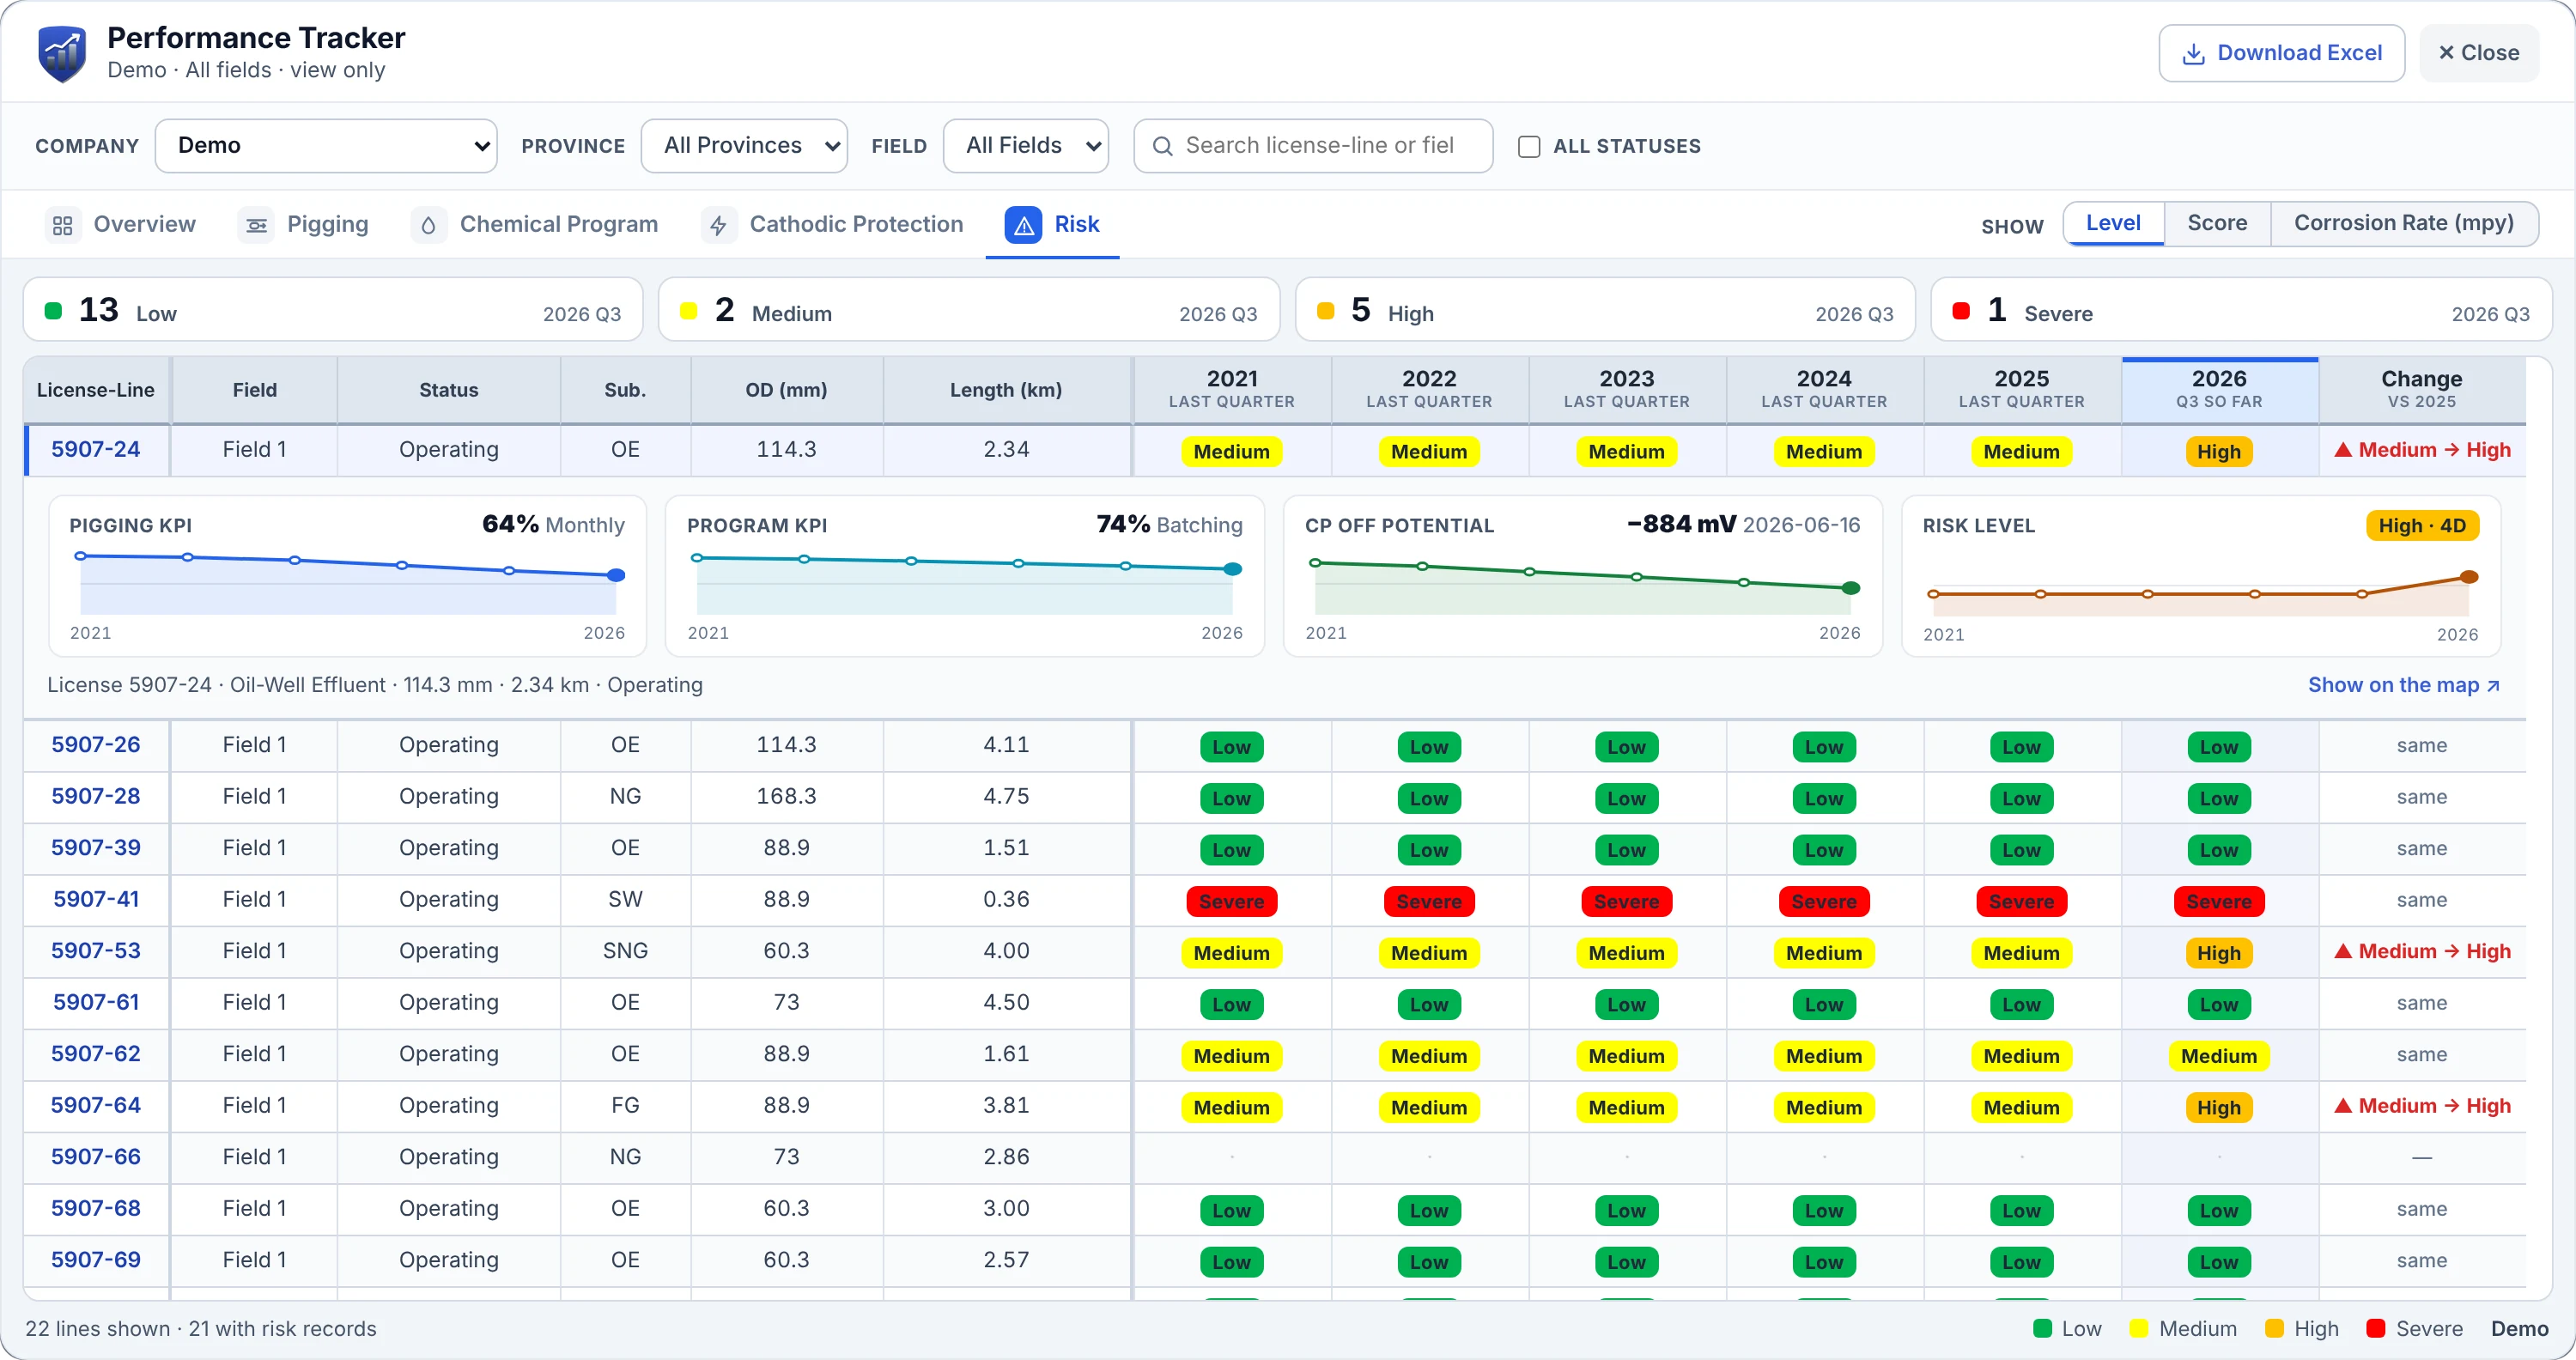
PipeGuard’s Performance Tracker
The Performance Tracker brings each line’s pigging, chemical treatment, cathodic protection and risk results together in one table, with six years of history and year-over-year changes highlighted. Results can be filtered by field or status, any line can be opened to view its trends, and the full table can be exported to Excel.
Generate Reports
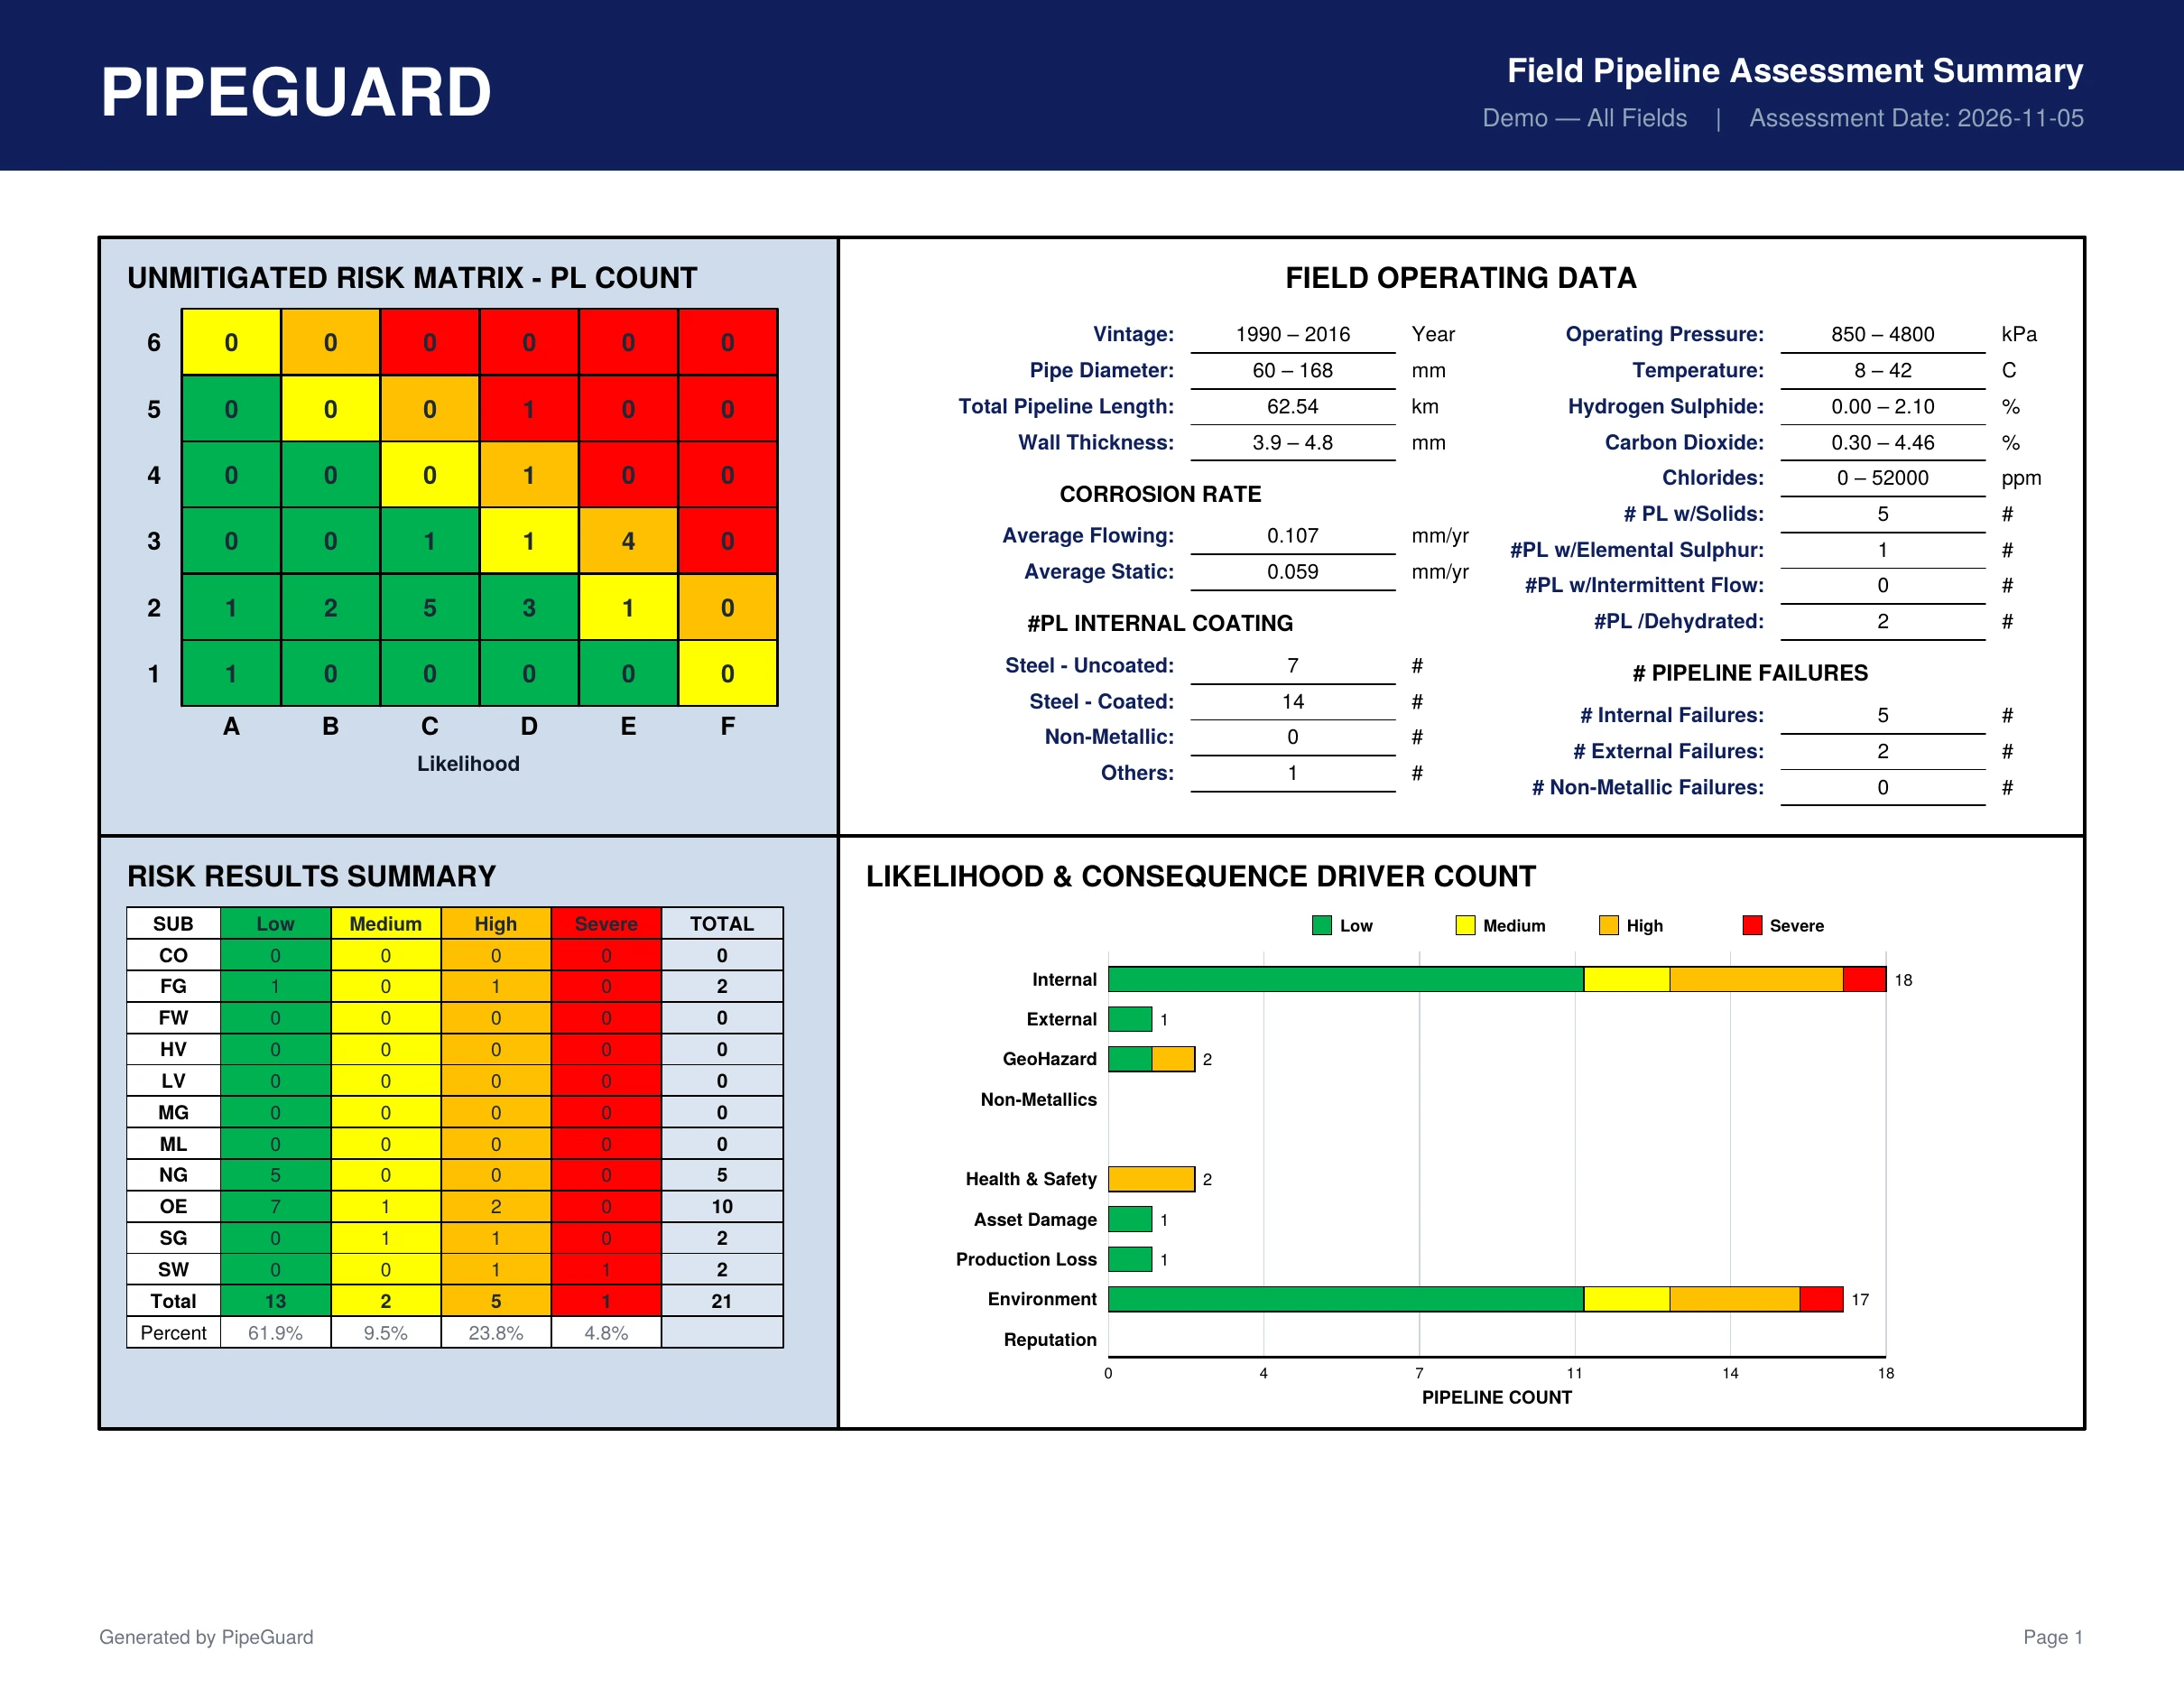
Reports can be generated for a single field, a list of licences or a selection made on the map, and exported in PDF or Excel. The Pipeline Risk Report sets out a line’s full assessment page by page, so every result can be traced back to the inputs behind it.
Risk Reports
Field Summary, Risk Assessment and Pipeline Risk Report, covering risk at the field and individual line level.
Operation Reports
Production, failure history and connectivity, to support day-to-day operating decisions.
Compliance Reports
Licensing anomalies and pipelines licensed as operating with no flow, to keep licence records accurate.
KML for Google Earth
Pipelines exported for offline viewing in Google Earth, coloured by risk, substance or pigging KPI.
Pre-acquisition Reports
An assessment of another company’s licensed pipelines and wells from public records, prepared before an acquisition.
Your data stays yours
Your data is secure. PipeGuard runs on secure, locally hosted servers that are maintained and monitored by experienced database engineers. The platform makes no outbound calls to the internet: regulatory datasets are downloaded and indexed on the server, and no information about your pipelines is sent to outside services.
Getting started
See PipeGuard in action. Schedule a demo and we will walk you through every feature, from the map and risk engine to reports and performance tracking, using a demo company built from real licensed pipelines or a field of your own.